Histograms and stem-and-leaf plots

What are histograms? What are stem-and-leaf plots?
A histogram, also called a frequency histogram, is just like a bar graph, except that we collect the data into buckets or bins, and then sketch a bar for each bucket. Each bucket needs to be the same size so that they’re capable of holding the same amount of data.

Hi! I'm krista.
I create online courses to help you rock your math class. Read more.
Unlike bar charts, histograms have no gaps between the bars (although some bars might be absent, which means there’s no frequency in that “bucket”). A histogram represents a continuous data set, which is why there are no gaps between the buckets.
One reason you might want to use a histogram instead of a bar graph is because you have too many data points to plot individually. For example, maybe you want to use census data to make a graph of the number of people of each age in the entire city of San Francisco. In a typical bar graph, you have to show a bar for children younger than ???1???, another for ???1???-year-olds, for ???2???-year-olds, ???3???, ???4???, ???5???, all the way up to ???100??? or maybe even older. In other words, your bar graph might have ???100??? bars or more.
A histogram is the perfect solution to an overly-complicated bar graph. To create a histogram for the same information, you might group together ???0-9??? year-olds, ???10-19??? year-olds, ???20-29??? year-olds, etc. Notice that each of these buckets is the same size or length. That’s important to remember when making a histogram. Putting people of similar age together in those groups would allow you to create a histogram with around ???10??? bars, instead of a bar graph with around ???100??? bars. The histogram might look like this:
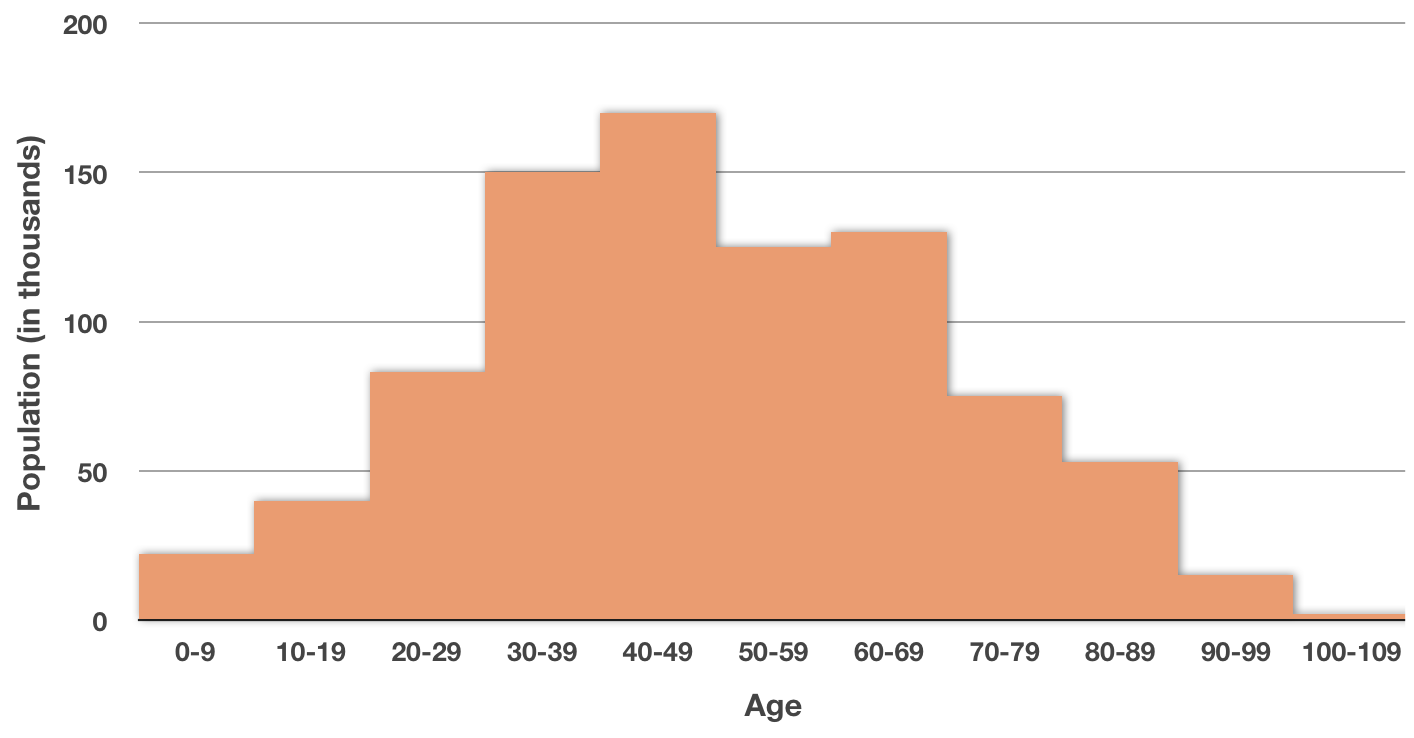
The way the data is spread out in the histogram is called the distribution. As a very general rule, qualitative data is usually better in a bar graph, and quantitative data is usually better in a histogram.
Stem-and-leaf plot
A stem-and-leaf plot (also called a stem plot), is just another way to summarize data. It’s similar to a histogram, because both types of charts group together data points, and are good ways to show how many data points fall into a certain category or range.
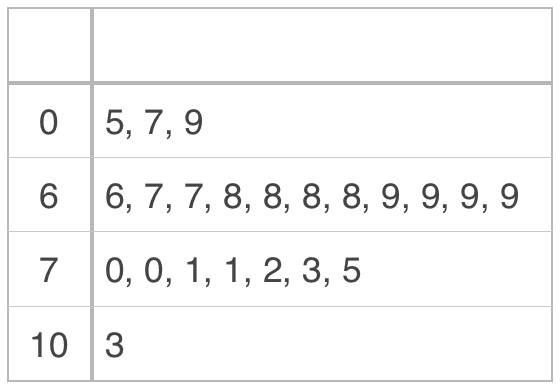
For stem-and-leaf plots, we group data together by the first digit(s) in each number. In other words, let’s say we have the finishing scores of golfers in a round of tournament golf:
???66,\ 67,\ 67,\ 68,\ 68,\ 68,\ 68,\ 69,\ 69,\ 69,\ 69,\ 70,\ 70,\ 71,\ 71,\ 72,\ 73,\ 75???
We could create a stem plot of the scores.

Let’s use this particular plot to talk about what a stem plot shows. First, the “stems” are the numbers on the left, in this case the ???6??? and the ???7???. The “leaves” are all the other numbers on the right.
Each leaf represents one data point, in this case one golf score. So if we want to know how many data points are in the set, we could count the number of leaves on the right side. In this plot, there are ???18??? leaves, which means we collected ???18??? golf scores.
Notice that we also put “???6|6=66???” below the stem-and-leaf plot. This is a key, or legend, that tells us that we intended for the stem to represent the tens plane, and for the leaf to represent the units place. If the key had said ???6|6=606???, that would have meant that each stem represented the hundreds place (???6??? would indicate ???600???), and the leaf would represent the units place (???6??? would indicate ???6???).
Each leaf needs to be attached to the stem from the same row in order to give you each data point. In other words, the stem isn’t a data point on its own, and neither is the leaf. They only make a data point when you put them together. So if we take the first stem, ???6??? tens, and the first leaf, ???6??? ones, we put them together to get ???66???, and that’s one golf score. If we put the second leaf, ???7??? ones, with the stem, we get ???67???, which is another golf score in our data set. We could do this up to the last leaf on that line, to get golf scores from the first line of our plot of
???66,\ 67,\ 67,\ 68,\ 68,\ 68,\ 68,\ 69,\ 69,\ 69,\ 69???
We could do the same with the second line to see that we also have scores of
???70,\ 70,\ 71,\ 71,\ 72,\ 73,\ 75???
No digit, or more than one digit in the stem?
In a stem-and-leaf plot, the leaf will always only have one digit, and the stem will take the rest of the digit. So for example, if another golfer had a terrible day and scored ???103??? and we wanted to add his score into our plot, we’d make the ???3??? the leaf, and the ???10??? would be the stem.
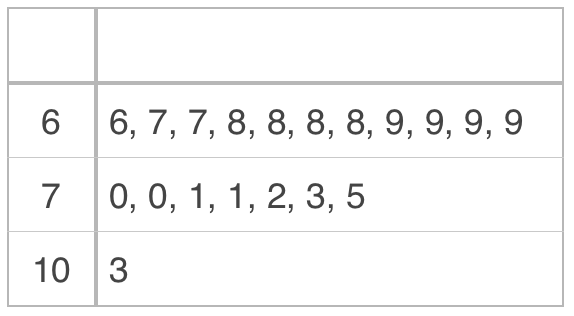
Even single-digit numbers can be included in a stem plot. If we wanted to add data points of ???5???, ???7??? and ???9??? to our plot, we can either leave the stem blank,
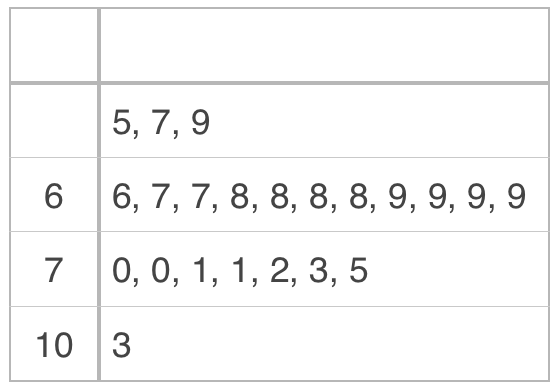
or put a ???0??? in the stem spot.