Transforming random variables by shifting and scaling the data set

Shifting a data set vs. scaling a data set
Remember previously that we talked about how our measures of central tendency and spread would change if we shifted or scaled our data set.
Shifting the data set by a constant ???k??? means adding ???k??? to every value in the data set, or subtracting ???k??? from every value in the data set.
On the other hand, scaling the data set by a constant ???k??? means multiplying or dividing every value in the data set by ???k???.

Hi! I'm krista.
I create online courses to help you rock your math class. Read more.
We learned that shifting the data set would shift the mean, median and mode by the same amount as the constant, but that the range and IQR would stay the same. For example, shifting a data set up by ???k??? might look like this:
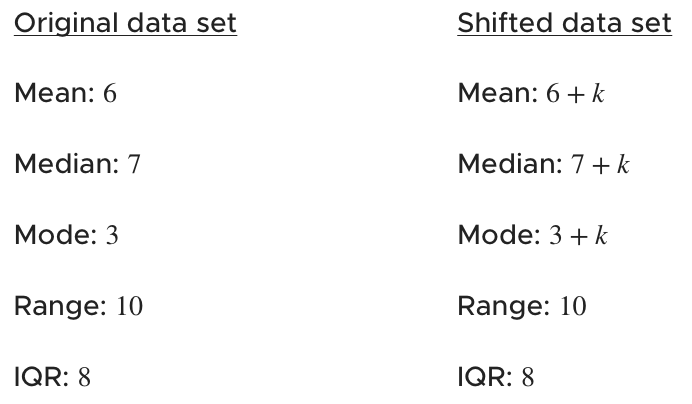
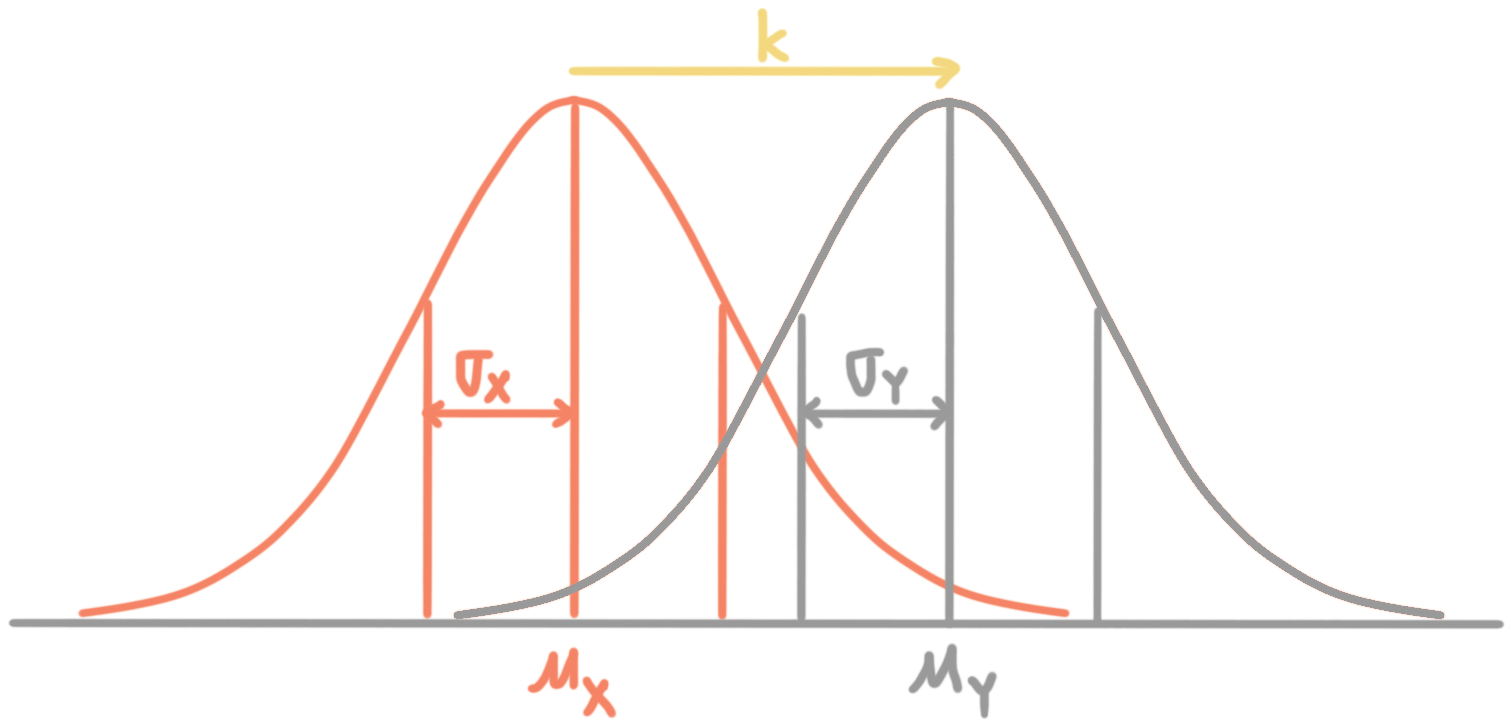
To this list, let’s add standard deviation. When we shift the data set up or down by ???k??? units, the standard deviation will stay the same. So
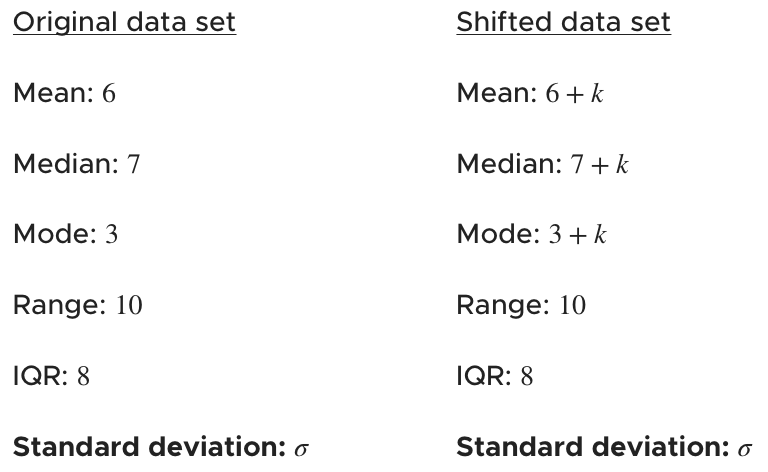
Here’s how we’d visually represent shifting in the data.
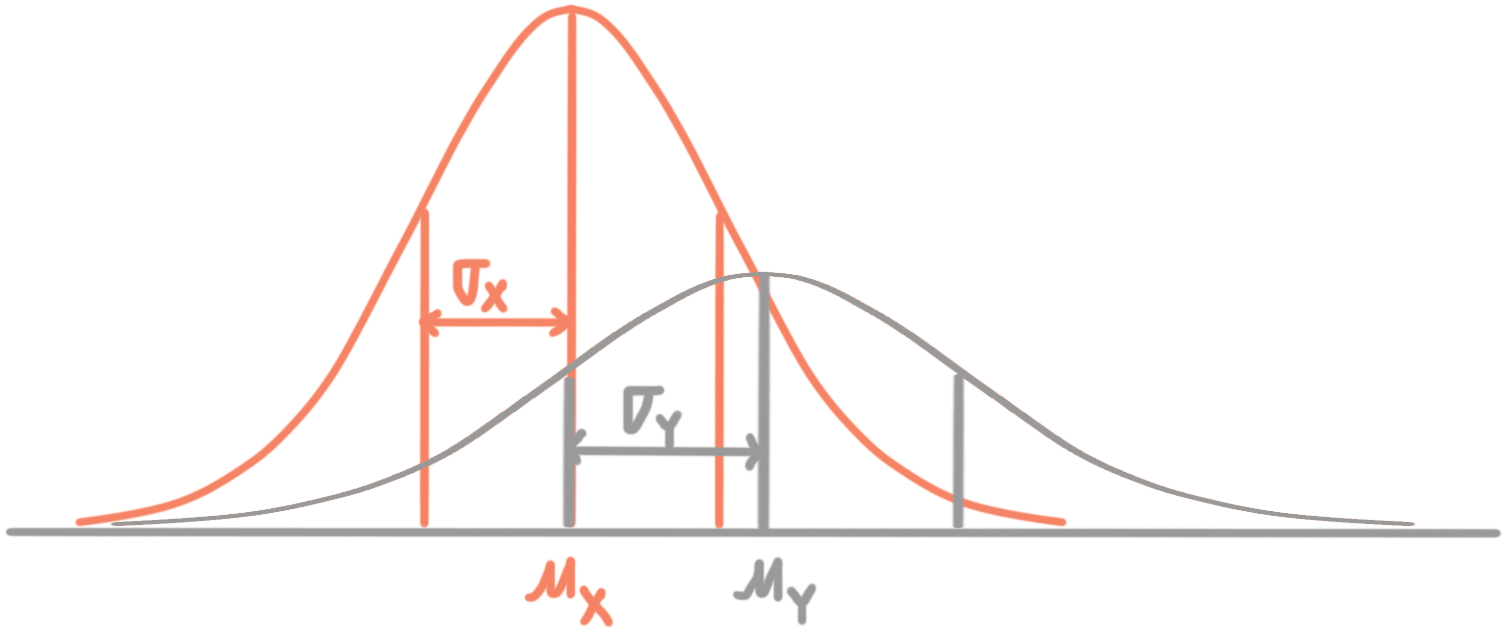
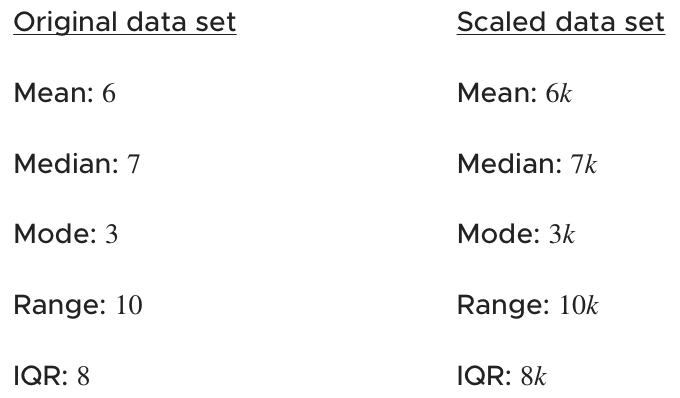
We also learned that scaling the data set would equally scale the mean, median, mode, range and IQR. In other words, they all scale by the same factor. For example, scaling a data set by multiplying by ???k??? might look like this:
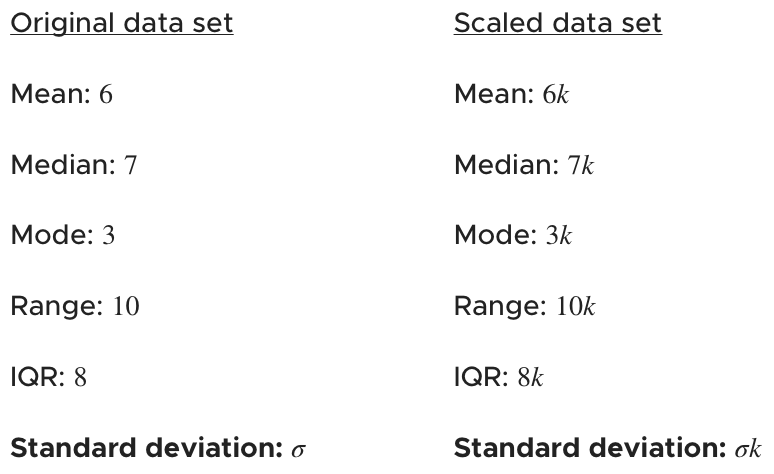
But when we scale the data set by ???k??? units, the standard deviation will scale by the same value. So
Here’s how we’d visually represent scaling in the data. The original distribution would become the new scaled version: