
Sampling distribution of the sample proportion

Building the sampling distribution of the sample proportion
In the same way that we were able to find a sampling distribution for the sample mean, we can find a sampling distribution for the sample proportion.
When we found the sampling distribution of the sample mean, we did that for a population with continuous probability distribution, where the population has a population mean ???\mu???.

Hi! I'm krista.
I create online courses to help you rock your math class. Read more.
But if instead we’re dealing with a population with a binomial probability distribution, where the population has a population proportion ???p???, then we’ll be trying to create sampling distribution of the sample proportion, as opposed to a sampling distribution of the sample mean.
The population proportion
Often we’ll want to calculate a population proportion ???p???, which is the number of subjects in our population that meet a certain criterion.
For example, maybe we want to know how many students in our school have brown hair. If there are ???5,000??? students who attend our school, it might not be possible to survey everybody. So instead we could take a random sample of ???100??? students and see how many of them have brown hair. This is the sample proportion, since it’s the proportion of students in the sample with brown hair, which is given by
???\hat p=\frac{x}{n}???
where ???x??? is the number of people in the sample with brown hair (the number of “successes”) and ???n??? is the sample size (we surveyed ???100??? people for each of our samples).
To get an even better estimate of the population proportion, we could take lots and lots of samples of ???100??? students each and calculate the sample proportion for each sample. Eventually, we’d end up with many many sample proportions. Those values will vary around whatever the actual population proportion is. If we take all of those sample proportions and graph them as a distribution, we get the sampling distribution of the sample proportion.
Conditions for inference
The conditions for inference that apply to the sampling distribution of the sample proportion are similar to the conditions we applied to the sampling distribution of the sample mean.
Random sampling
Any sample we take needs to be a simple random sample. Often we’ll be told in the problem that sampling was random.
Normal condition, large counts
For population proportions, a sampling distribution is only normal if ???np\ge 10??? and ???n(1-p)\ge 10???, where ???n??? is the number of subjects in the sample and ???p??? is the population proportion. If ???np\ge 10??? is true, it tells us that we have at least ???10??? “successes” in our sample. If ???n(1-p)\ge 10??? is true, it tells us that we have at least ???10??? “failures” in our sample.
So if our sample size is ???n=100??? and the population proportion is ???p=60\%???, then we want to multiply ???100??? by ???0.6???, and ???100??? by ???1-0.6=0.4??? to make sure both values are at least ???10???.
???100\cdot0.6=60>10???
???100\cdot0.4=40>10???
Since both values are at least ???10???, the distribution is approximately normal. If one or both values were less than ???10???, then the distribution would be right-skewed if the population proportion ???p??? is small, and left-skewed if the population proportion ???p??? is large.
Independence condition, ???10\%??? rule
If we’re sampling with replacement, then the ???10\%??? rule tells us that we can assume the independence of our samples. But if we’re sampling without replacement (we’re not “putting our subjects back” into the population every time we take a new sample), then we need keep the number of subjects in our samples below ???10\%??? of the total population (or keep the number of samples below ???10\%??? of the total population).
Mean and standard deviation
The mean of the sampling distribution of the sample proportion ???\mu_{\hat p}??? will be equal to the population proportion ???p???.
???\mu_{\hat p}=p???
The standard deviation of the sampling distribution of the sample proportion ???\sigma_{\hat p}???, also called the standard error of the proportion, will be
???\sigma_{\hat p}=\sqrt{\frac{p(1-p)}{n}}???
where ???p??? is the population proportion and ???n??? is the sample size. In order for this standard deviation of the sampling distribution to be valid, the sample size needs to follow the ???10\%??? rule.
How to use the sampling distribution of the sample proportion


Take the course
Want to learn more about Probability & Statistics? I have a step-by-step course for that. :)
Calculating probability from the sampling distribution of the sample proportion
Example
An ice cream shop claims that ???40\%??? of their ???1,000??? customers order their ice cream in a waffle cone. You want to verify this claim, so you take a random sample of ???5\%??? customers and see whether or not they order a waffle cone.
What is the probability that your results are within ???5\%??? of the ice cream shop’s ???40\%??? claim?
Our first step is always to verify normality. In our case, ???n=90??? and ???p=0.4???. Which means ???1-p=0.6???.
???np=(90)(0.4)=36\ge 10???
???n(1-p)=(90)(1-0.4)=(90)(0.6)=54\ge 10???
Then we always need to check the ???10\%??? rule. Our sample is ???90??? of the total population of ???1,000???, which means it’s ???90/1,000=9\%???. We’re not violating the ???10\%??? rule, and we’re told in the problem that the sample was random.
With those conditions out of the way, we need to calculate the mean and standard deviation for the sample. The mean is
???\mu_{\hat p}=p???
???\mu_{\hat p}=0.4???
and the standard deviation is
???\sigma_{\hat p}=\sqrt{\frac{p(1-p)}{n}}???
???\sigma_{\hat p}=\sqrt{\frac{0.4(1-0.4)}{90}}???
???\sigma_{\hat p}=\sqrt{\frac{0.24}{90}}???
???\sigma_{\hat p}=0.0516???

The conditions for inference that apply to the sampling distribution of the sample proportion are similar to the conditions we applied to the sampling distribution of the sample mean.
Now that we have the mean and standard deviation, we can imagine a normal distribution with ???\mu_{\hat p}=0.4??? and ???\sigma_{\hat p}=0.0516???. The question asks us the probability that our results are within ???5\%??? of population proportion ???p=40\%???. In other words, how likely is it that the mean of the sample proportion falls between ???35\%??? and ???45\%???? Since ???5\%=0.05???, we can say that ???5\%??? is
???\frac{0.05}{0.0516}\approx0.97???
standard deviations from the mean. Which means we want to know the probability of ???P(-0.97<z<0.97)???.
In a ???z???-table, a ???z???-value of ???0.97??? gives ???0.8340???,

and a value of ???-0.97??? gives ???0.1660???.
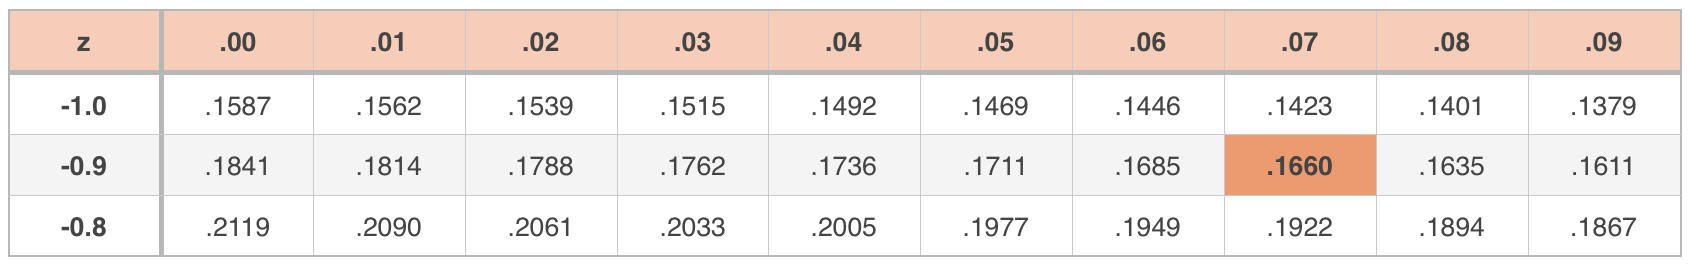
Which means the probability under the normal curve between these ???z???-scores is
???P(-0.97<z<0.97)=0.8340-0.1660???
???P(-0.97<z<0.97)=0.668???
???P(-0.97<z<0.97)\approx67\%???
Which means there’s an approximately ???67\%??? chance that our sample proportion will fall within ???5\%??? of the ice cream shop’s claim. In other words, approximately ???67\%??? of our samples will produce a sample proportion that’s within ???5\%??? of the population proportion.
