
Understanding joint, marginal, and conditional distributions

What are joint distributions?
A joint distribution is a table of percentages similar to a relative frequency table. The difference is that, in a joint distribution, we show the distribution of one set of data against the distribution of another set of data.

Hi! I'm krista.
I create online courses to help you rock your math class. Read more.
Let’s say we study a group of ???100??? individuals, measuring the average number of hours each participant spent exercising each week over the course of the study, and we also gathered data about the total number of pounds of weight lost in total by each participant over that same period of time.
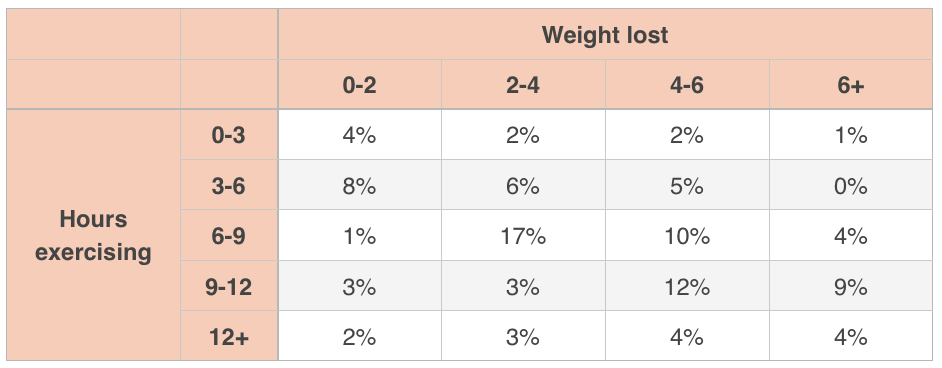
From this table, we can see that ???4\%??? of the group, which would be ???4??? out of the ???100??? people studied, spent between ???0??? and ???3??? hours per week exercising, and lost between ???0??? and ???2??? pounds. More people in the study (???17\%??? or ???17??? out of the ???100???) exercised between ???6??? and ???9??? hours per week on average and lost between ???2??? and ???4??? pounds in total.
This is an example of a joint distribution because we’re comparing the distribution of two distributions: the distribution of average weekly hours spent exercising, and the distribution of total weight lost over the course of the study.
When we read a joint distribution table, we’ll oftentimes look at marginal and conditional distributions within the table.
Marginal distribution
We could total up the data in each row and each column, and add those totals to the table:

Think of a marginal distribution as the Total column or the Total row in this joint distribution. It’s like only having one of the distributions, not both. So if you only had the distribution of weight lost, you’d have just the totals along the bottom of the table.

This table gives us the marginal distribution for weight lost; it tells us the percentage of participants who lost ???0-2??? pounds, ???2-4??? pounds, etc. But it doesn’t give us any information about how much exercise they did.
You could also look at only the distribution for hours spent exercising, taking the totals along the right side of the original joint distribution.
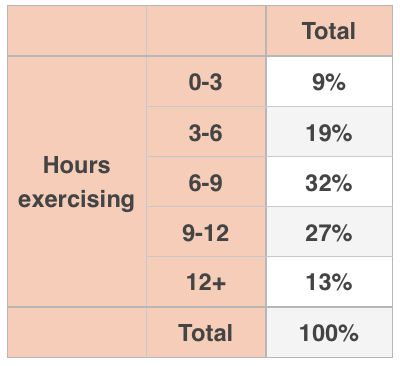
The is the marginal distribution for hours of exercise, and we can see the percentage of participants who spent ???0-3??? hours exercising, ???3-6??? hours exercising, etc. But this table doesn’t give us any information about how much weight was lost based on how many hours were spent exercising.
Conditional distribution
Think of a conditional distribution as the distribution of one variable, given a particular value of the other variable.
For example, you could look at the conditional distribution of weight lost, given a particular amount of hours spent exercising:
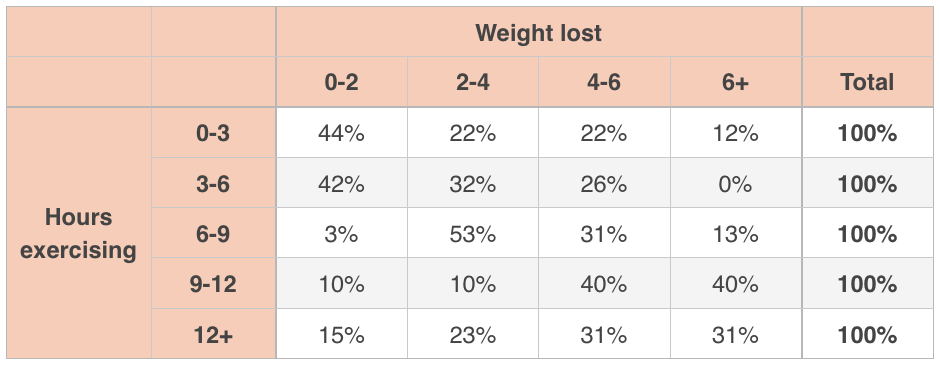
Looking at the top row of this conditional distribution, we can say this:
Given that people spent ???0-3??? hours exercising,
???44\%??? of them lost ???0-2??? pounds,
???22\%??? of them lost ???2-4??? pounds,
???22\%??? of them lost ???4-6??? pounds,
???12\%??? of them lost ???6+??? pounds.
But this distribution is conditional on ???0-3??? hours spent exercising. Notice that the distributions in the table are conditional upon the value of hours spent exercising in each row, so we see the row totals at ???100\%???.
Or we could look at the conditional distribution of hours exercising, given a particular amount of weight lost:
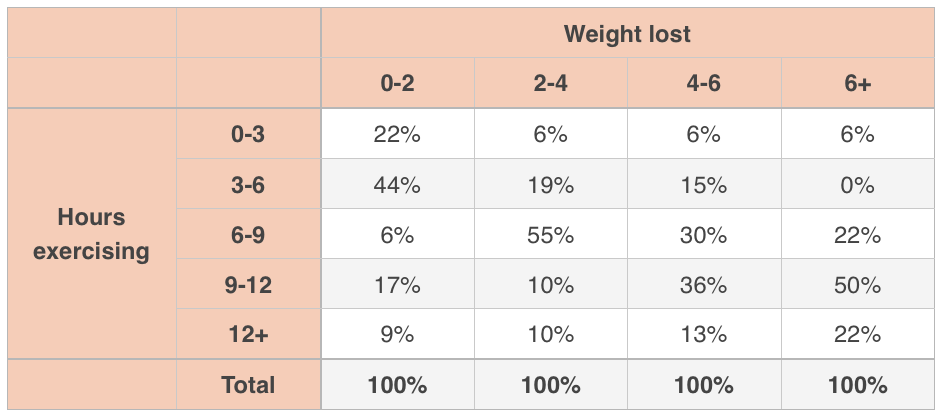
Looking at the first column of this conditional distribution, we can say this:
Given that people lost ???0-2??? pounds of weight,
???22\%??? spent ???0-3??? hours exercising,
???44\%??? spent ???3-6??? hours exercising,
???6\%??? spent ???6-9??? hours exercising,
???17\%??? spent ???9-12??? hours exercising,
???9\%??? spent ???12+??? hours exercising.
But this distribution is conditional on ???0-2??? pounds weight lost. Notice that the distributions in the table are conditional upon the value of pounds of weight lost in each column, so we see the column totals at ???100\%???.


